Microsoft Sentinel provides two different options on collecting security logs from an on-premise server. Here is the simple straight way using legacy agent option.
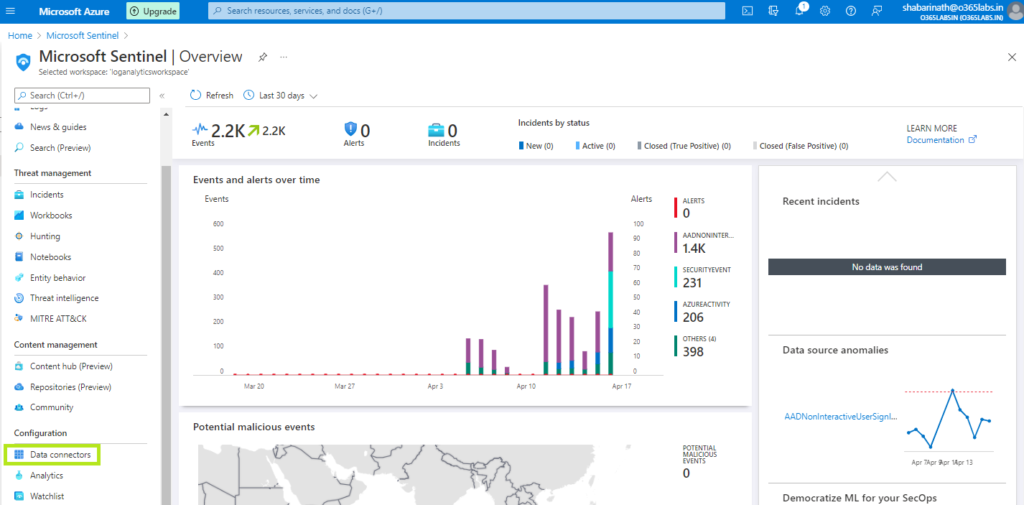
Navigate to the Data Connectors from Azure Sentinel dashboard.
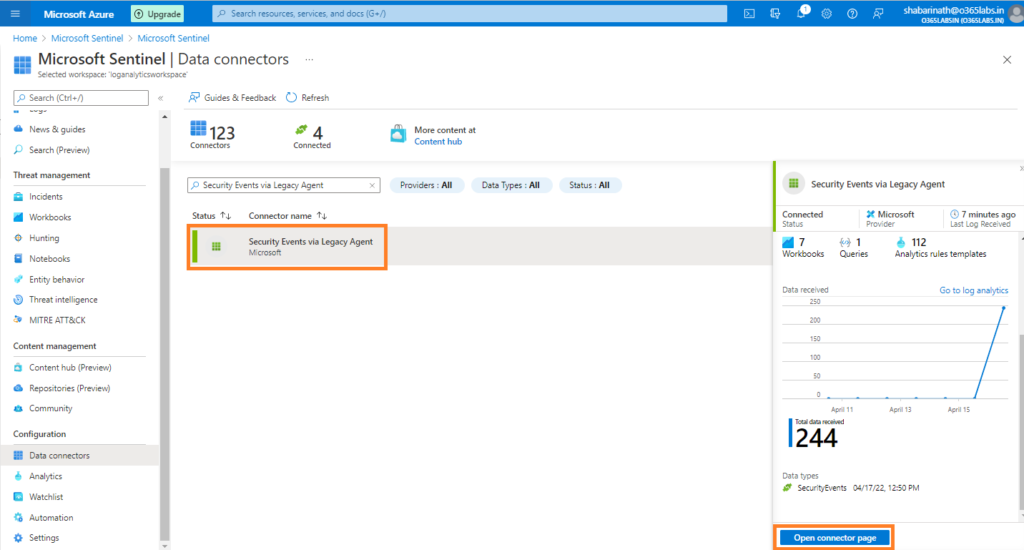
Search for “Security Events via Legacy Agent” and click on “Open Connector” at the bottom right corner.
Download the agent from the link provided. Microsoft has two different agent types – One for VMs hosted in Azure and the other for VMs hosted in all other environments other than azure.
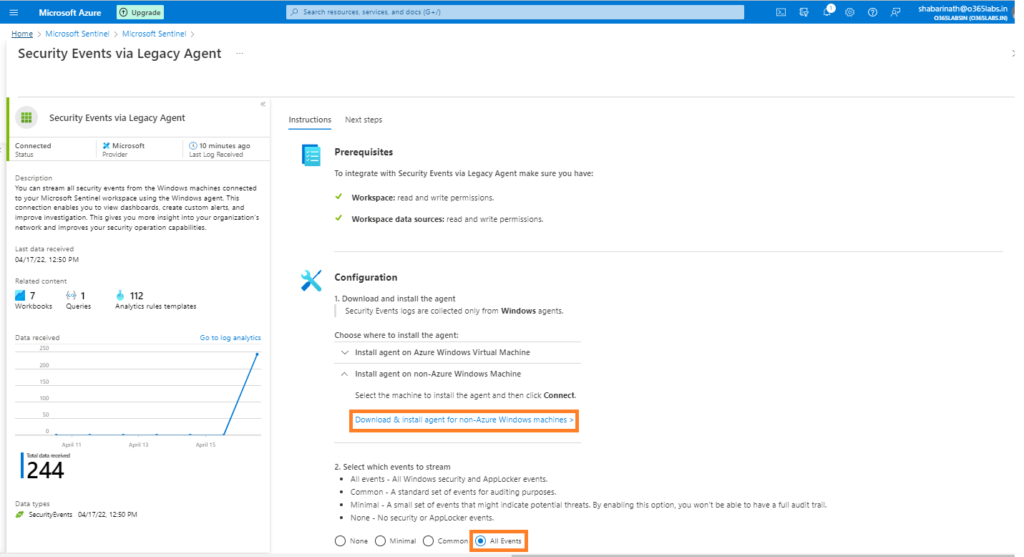
On the events to stream option, Select the appropriate one. Since I was not sure about the full list of events in different categories, I opted for “All Events”.
On the download agent page, We have the 32bit agent as well as 64bit agent. And the workspace ID and the key. Workspace ID and the keys are used while installing the agent on the on-premise server. If the server doesn’t have a direct internet connectivity, Microsoft gives us an option to use a gateway server. All on-premise servers will send logs to Log Analytics Gateway server and gateway server will then send the logs to Azure Log Analytics Workspace. Since I did this on my lab environment, I have unrestricted internet for the domain controllers. Hence, the events are directly sent to Azure LA workspace.
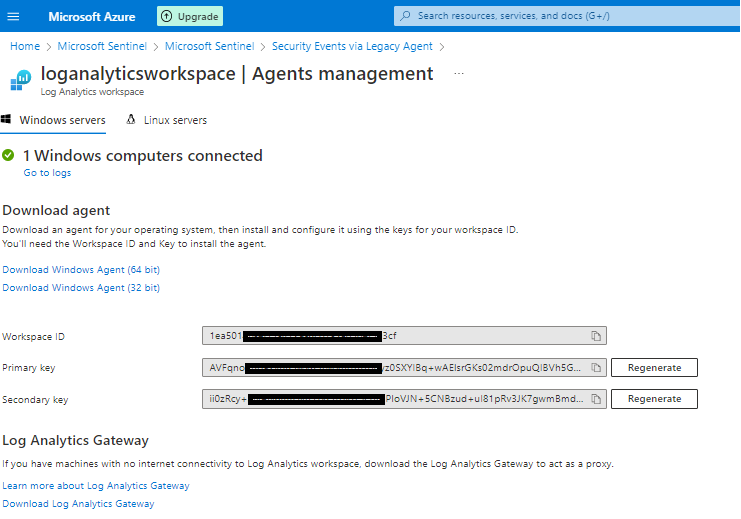
Now, navigate to the server. Get the agent downloaded and keep the workspace ID and the key handy. Primary key or secondary key – either one is required.
This agent is basically MOM agent with additional functionality for integrating with Azure Log Analytics.
On the welcome screen, click next. Accept the license agreement and click next.
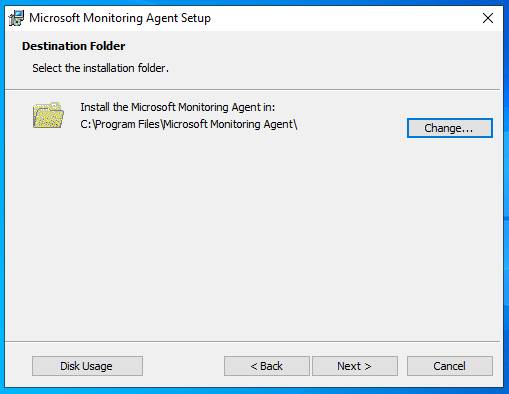
Choose the installation folder
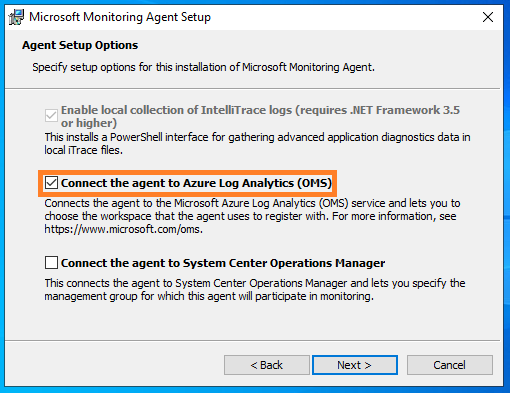
Choose “Connect the agent to Azure Log Analytics (OMS)” and click next
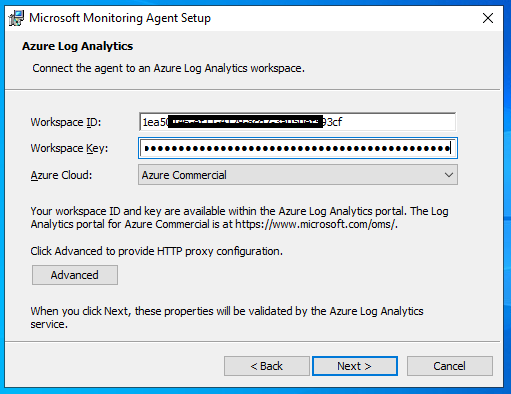
Now, Its the time to configure the workspace ID and the key. In case a proxy is used, configure the proxy settings too using the Advanced button.
Choose the Windows update option as per your wish and go ahead with the installation.
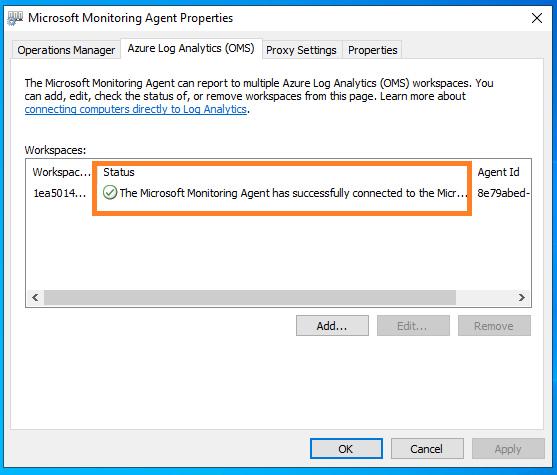
Once installation is complete, Verify the agent health from Control Panel -> Microsoft Monitoring Agent. If the connectivity is fine, A green tick mark will be visible on the status column.
In few minutes, the changes will be reflected on the azure sentinel connector page.
One of the main concerns on using legacy agent is on the time required on getting the events in Azure Log analytics. I did a small test to verify this and it was quick.
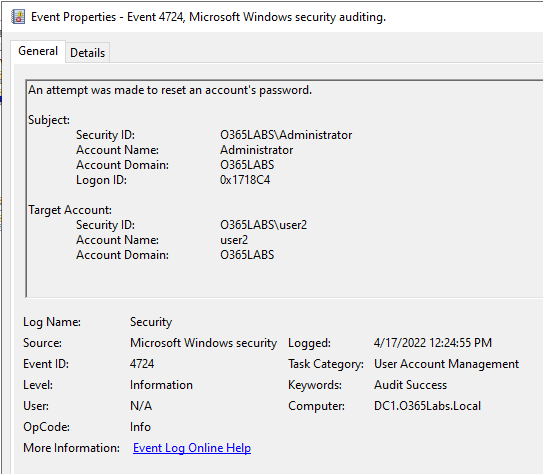
Here is the raw event from Windows Security event.
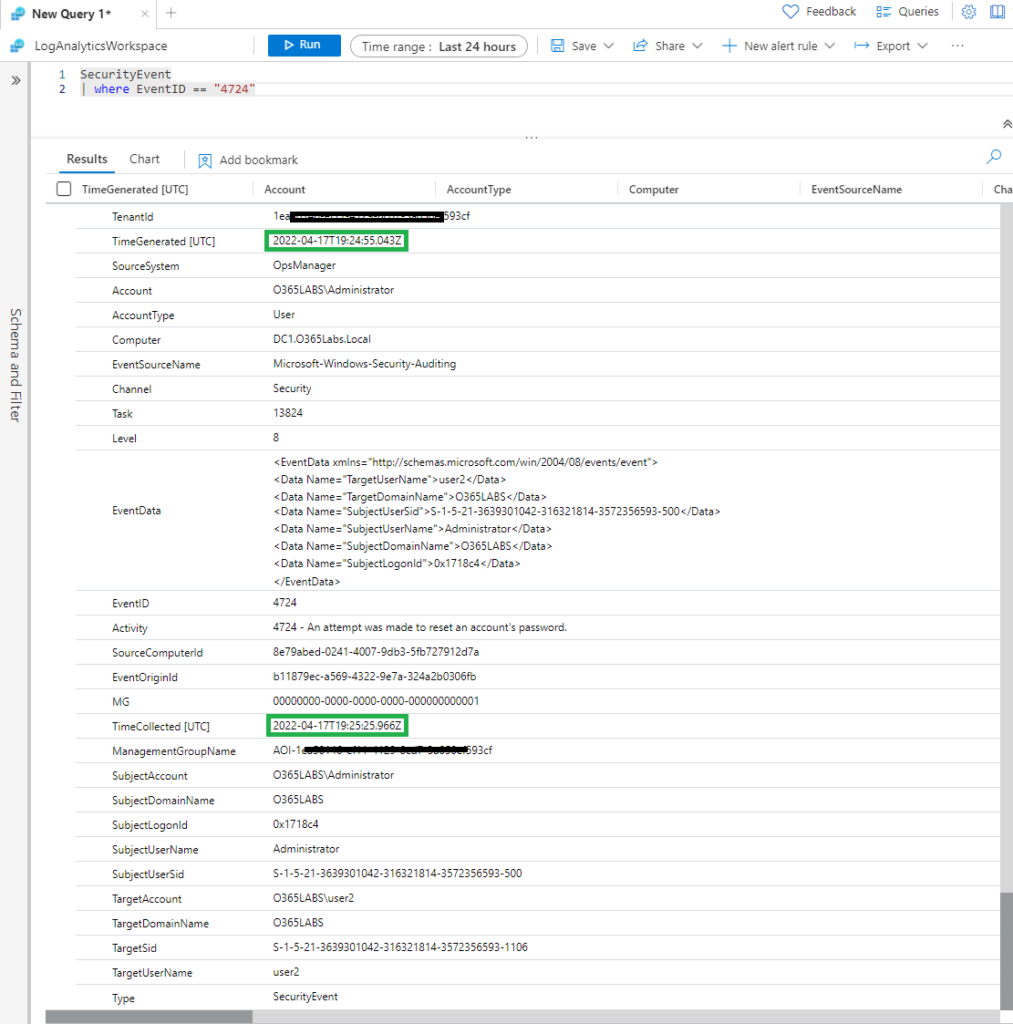
I then searched the Azure Log Analytics workspace. For the respective event, Microsoft is also stamping an additional filed called time collected. Time generated is the actual time event was triggered. Both fields are in UTC. If you see, the event got collected with in a minute once it was generated. And it was available in the Azure Log Analytics workspace with in 3-4 minutes.
Refer the Azure Sentinel data collection best practices here.